Updates
This form does not yet contain any fields.

    Connect with Jackie


    US National Debt
    Learn more about us debt.
    Campaign Photos

    News Articles

    Thursday
    May242012

    Real federal deficit dwarfs official tally

    By Dennis Cauchon, USA TODAY


    The typical American household would have paid nearly all of its income in taxes last year to balance the budget if the government used standard accounting rules to compute the deficit, a USA TODAY analysis finds

    Under those accounting practices, the government ran red ink last year equal to $42,054 per household — nearly four times the official number reported under unique rules set by Congress.

    A U.S. household's median income is $49,445, the Census reports.

    The big difference between the official deficit and standard accounting: Congress exempts itself from including the cost of promised retirement benefits. Yet companies, states and local governments must include retirement commitments in financial statements, as required by federal law and private boards that set accounting rules.

    The deficit was $5 trillion last year under those rules. The official number was $1.3 trillion. Liabilities for Social Security, Medicare and other retirement programs rose by $3.7 trillion in 2011, according to government actuaries, but the amount was not registered on the government's books.

    Deficits are a major issue in this year's presidential campaign, but USA TODAY has calculated federal finances under accounting rules since 2004 and found no correlation between fluctuations in the deficit and which party ran Congress or the White House.

    Key findings:

    •Social Security had the biggest financial slide. The government would need $22.2 trillion today, set aside and earning interest, to cover benefits promised to current workers and retirees beyond what taxes will cover. That's $9.5 trillion more than was needed in 2004.

    •Deficits from 2004 to 2011 would be six times the official total of $5.6 trillion reported.

    •Federal debt and retiree commitments equal $561,254 per household. By contrast, an average household owes a combined $116,057 for mortgages, car loans and other debts.

    "By law, the federal government can't tell the truth," says accountant Sheila Weinberg of the Chicago-based Institute for Truth in Accounting.

    Jim Horney, a former Senate budget staff expert now at the liberal Center on Budget and Policy Priorities, says retirement programs should not count as part of the deficit because, unlike a business, Congress can change what it owes by cutting benefits or lifting taxes.

    "It's not easy, but it can be done. Retirement programs are not legal obligations," he says.

    ---

    Read more at USA Today: http://www.usatoday.com/news/washington/story/2012-05-18/federal-deficit-accounting/55179748/1

    Tuesday
    May222012

    Discouraged Workers Still Giving Up, Driving Down Work Force, Poll Finds

    (CNSNews.com) Discouraged workers are continuing to exit the labor force after giving up hope of finding a job, driving down the unemployment rate as they exit a new Gallup unemployment survey found.

    The survey, conducted midway through the month of May, found that the unemployment rate – as measured by Gallup – declined from 8.3 percent in April to 8.2 percent in mid-May.

    Gallup’s survey is different from the official unemployment rate compiled by the federal Bureau of Labor Statistics (BLS) in that the Gallup survey is a 30-day tracking survey conducted from mid-April to mid-May. In contrast, BLS conducts its survey over one week in mid-May.

    The Gallup survey found that unemployment – slightly higher than the official rate of 8.1 percent – declined slightly. However, Gallup also found that the workforce participation rate – the percentage of eligible people working or actively looking for work – also declined slightly from 67.8 percent to 67.5 percent.

    Recent declines in the official unemployment rate have been due in large part to similar declines in the workforce as discouraged workers gave up looking for work.

    The official unemployment rate has steadily fallen from its post-recession high of 10 percent nearly a year and a half ago, to 8.1 percent today. However, job creation has been at or below 250,000 jobs per month for much of that time.

    As job creation has continued to be so low – barely enough to keep up with the natural growth in the working-age population – the declines in the unemployment rate have largely come instead from discouraged workers leaving the workforce.

    Gallup’s mid-month survey suggests that this months-long trend of discouraged workers fleeing the workforce is continuing in May.

    “Much of this decline may be due to a decline in the workforce participation rate – Americans 18 years or older who have a job or are actively looking for work – which fell to 67.5 percent in mid-May from 67.8 percent in March. As people get discouraged and drop out of the workforce, the unemployment rate tends to decline,” Gallup said in a May 17 news release accompanying the poll.

    Gallup found other results that could point to discouraged workers still leaving the workforce – among them a smaller decline in the unemployment rate than a year ago and a decline in the under-employment rate.

    Under-employment – unemployed persons and those working part-time because they cannot find full-time work – fell from 18.2 percent in April to 18 percent in mid-May, Gallup found.

    Gallup also found that the decrease in the unemployment rate – typical for this time of year – was not nearly as large as last year’s decrease, suggesting that employers may not be hiring as much this spring as they did last spring due to the sluggish pace of the recovery.

    “[C]ompanies tend to increase their hiring during April and May. However, this year's slow economic growth and some extra hiring earlier this year may have employers holding back to some degree from their normal hiring increases.”

    Gallup noted that its findings – while usually in sync with the BLS figures – now show significantly higher unemployment and underemployment than the official figures. Gallup said the official figures were “inconsistent” with the state of the economy.

    “Gallup's unemployment measurements now and in April stand in sharp contrast to those the government provided,” Gallup said. “The BLS reported an April unadjusted unemployment rate of 7.7% and an adjusted unemployment rate of 8.1%. These findings were generally seen as inconsistent with the state of the economy and the findings of the BLS payroll survey.

    “There were not enough jobs created last month – even after the size of the workforce declined – to lower the unemployment rate as much as the government reported,” Gallup added.

    ---

    Read more at CNSNews.com: http://cnsnews.com/news/article/discouraged-workers-still-giving-driving-down-work-force-poll-finds

    Thursday
    May102012

    One in Three Young U.S. Workers Are Underemployed

    Young adults more than twice as likely as older adults to be underemployed

    May 9, 2012
    by Dennis Jacobe, Chief Economist


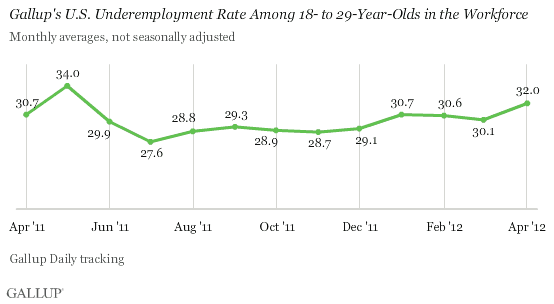
    PRINCETON, NJ -- Thirty-two percent of 18- to 29-year-olds in the U.S. workforce were underemployed in April, as measured by Gallup without seasonal adjustment. This is up from 30.1% in March and is slightly higher than the 30.7% of a year ago.

    zzmypoa3zkstv8vny9y-cw.gif

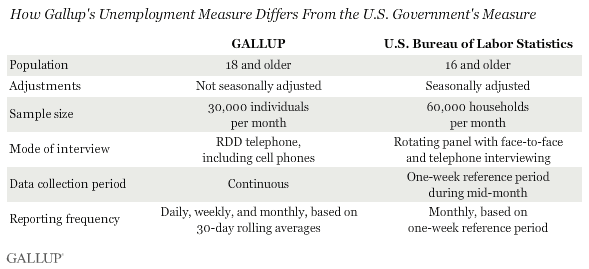
    These results are based on Gallup Daily tracking interviews, conducted with 28,215 Americans throughout April, including 2,864 respondents aged 18 to 29.

    Gallup's U.S. underemployment measure combines the unemployed with those working part time but looking for full-time work. Underemployment among 18- to 29-year-olds has hovered around 30% for most of the past year, showing no real improvement. Underemployment among all Americans has declined over the past year to 18.2% in April from 19.3% in April 2011.

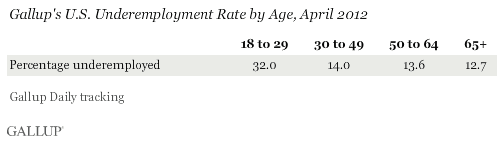
    Young adults were more than twice as likely as those in older age groups to be underemployed in April. Underemployment in April was 14.0% among those aged 30 to 49, 13.6% among those aged 50 to 64, and 12.7% among those 65 or older.

    Gallup's U.S. Underemployment Rate by Age, April 2012

    Unemployment Also Remains Stubbornly High Among Young Adults

    Unemployment among young adults, as measured by Gallup without seasonal adjustment, increased to 13.6% in April, up from 12.5% in March and the same as in April 2011. Overall unadjusted unemployment declined slightly to 8.3% in April from 8.4% in March.

    qi-ixazhkk-zhffgtzf4eq.gif

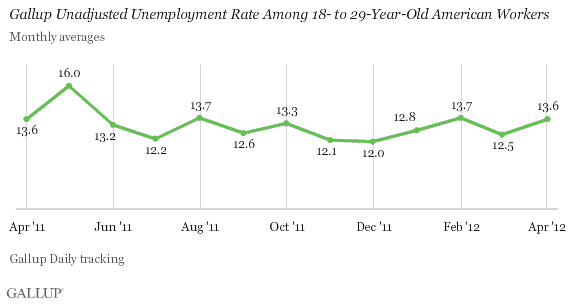
    Young adults continue to be much more likely than average to be unemployed; their 13.6% rate in April compares with 7.0% in the 30 to 49 age group, 6.2% among those aged 50 to 64, and 4.9% among those 65 or older.

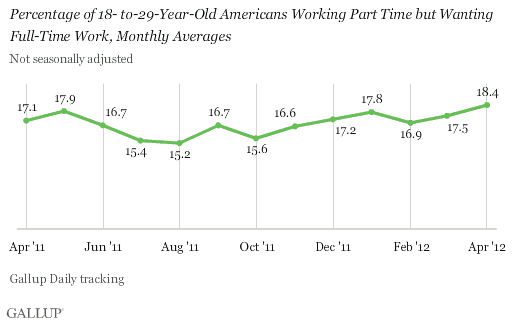
    More Now Than at Any Time in Past Year Working Part Time, Looking for Full-Time Job

    Another 18.4% of young adults in the workforce were working part time but wanting to work full time in April. This is up from 17.5% in March and 17.1% in April a year ago, and is the highest percentage of part-time young employees looking for full-time work seen during the past year.

    Percentage of 18-to-29-Year-Old Americans Working Part Time but Wanting Full-Time Work, Monthly Averages

    Those in the 30 to 49 (7.0% working part time, but want full-time work), 50 to 64 (7.4%), and 65 and older (7.7%) age groups are much less likely to fall into this part of the workforce.

    Implications

    Wall Street has generally viewed the government's unemployment report for April as a negative for the U.S. economy. Gallup's unemployment measures show that April has also brought gloomy job news for young Americans and underscores that this group has been struggling disproportionately for some time. Those aged 18 to 29 are more than twice as likely as those in any other age group to be underemployed.

    Additionally, while the unemployment rate among young adults in April is unchanged year over year, the underemployment rate has increased. A larger percentage of younger American workers are working part time but looking for full-time work today than were doing so in April 2011. That is, employers appear to be hiring younger Americans in greater numbers on a part-time basis this year than last, possibly in response to the current high level of economic uncertainty.

    Not surprisingly, given their relative lack of resources and experience, only 3.1% of young adults in April say they are self-employed. This compares with the 7.3% of all Americans in the workforce who report being self-employed. Thus, self-employment is also a job alternative that is less available to younger, less experienced Americans.

    Today's slow economic growth is a disaster for those unemployed and underemployed as they look for jobs when so few new jobs are being created. For younger Americans as a group, this is a particularly acute issue. Nearly one in three young adults in the workforce are not now able to gain full-time job experience. This not only hurts them temporarily, but deprives them of the experience they need to get a better job in the future. It also deprives U.S. companies of the skilled and experienced workers they will need for their businesses to prosper in the years ahead.

    How Gallup's Unemployment Measure Differs From the U.S. Government's Measure

    Gallup.com reports results from these indexes in daily, weekly, and monthly averages and in Gallup.com stories. Complete trend data are always available to view and export in the following charts:

    Daily: Employment, Economic Confidence, Job Creation, Consumer Spending
    Weekly: Employment, Economic Confidence, Job Creation, Consumer Spending

    Read more about Gallup's economic measures.

    View our economic release schedule.

    Survey Methods

    Results are based on telephone interviews conducted as part of Gallup Daily tracking from April 1-30, 2012, with a random sample of 28,215 adults, aged 18 and older, living in all 50 U.S. states and the District of Columbia, selected using random-digit-dial sampling.

    For results based on the total sample of national adults, one can say with 95% confidence that the maximum margin of sampling error is ±1 percentage point.

    Results for younger Americans 18 to 29 are based on telephone interviews conducted as part of Gallup Daily tracking from April 1-30, 2012, with a random sample of 2,864 adults, living in all 50 U.S. states and the District of Columbia, selected using random-digit-dial sampling.

    For results based on the total sample of national adults, one can say with 95% confidence that the maximum margin of sampling error is ±3 percentage points.

    Interviews are conducted with respondents on landline telephones and cellular phones, with interviews conducted in Spanish for respondents who are primarily Spanish-speaking. Each sample includes a minimum quota of 400 cell phone respondents and 600 landline respondents per 1,000 national adults, with additional minimum quotas among landline respondents by region. Landline telephone numbers are chosen at random among listed telephone numbers. Cell phone numbers are selected using random-digit-dial methods. Landline respondents are chosen at random within each household on the basis of which member had the most recent birthday.

    Samples are weighted by gender, age, race, Hispanic ethnicity, education, region, adults in the household, and phone status (cell phone only/landline only/both, cell phone mostly, and having an unlisted landline number). Demographic weighting targets are based on the March 2011 Current Population Survey figures for the aged 18 and older non-institutionalized population living in U.S. telephone households. All reported margins of sampling error include the computed design effects for weighting and sample design.

    In addition to sampling error, question wording and practical difficulties in conducting surveys can introduce error or bias into the findings of public opinion polls.

    For more details on Gallup's polling methodology, visit www.gallup.com.

    ---
    Read more at Gallup: http://www.gallup.com/poll/154553/One-Three-Young-Underemployed.aspx
    Friday
    May042012

    Jobs Data Point to Sluggishness 


    May 4, 2012

    WASHINGTON — U.S. job growth slowed again in April, a fresh sign that the economy could be settling into a sluggish spring.

    Nonfarm payrolls grew by 115,000 last month, the Labor Department said Friday. The unemployment rate, obtained by a separate survey of U.S. households, ticked down a tenth of percentage point to 8.1%.

    Economists surveyed by Dow Jones Newswires expected a gain of 168,000 in payrolls and for the jobless rate to remain at 8.2% in April.

    On a positive note, March payrolls grew by an upwardly revised 154,000 from an initially reported 120,000, and February payrolls posted a gain of 259,000, compared with an earlier estimate of 240,000.

    The unemployment rate has dropped since August, when it was 9.1%, though some of the decline has resulted from people leaving the work force. Federal Reserve officials have said that they expect only gradual progress the rest of this year. The Fed last week forecast that the unemployment rate would fall to somewhere between 7.8% and 8.0% by the end of this year.

    If the labor market stalls, the Fed could reconsider measures to stimulate the economy. "If unemployment looks like it's no longer making progress, that will be an important consideration in thinking about policy options," Fed Chairman Ben Bernanke said last week.

    Friday's report showed that private companies again fueled the growth, adding 130,000 jobs. Governments, meanwhile, cut payrolls by 15,000.

    Job growth came from a variety of sectors. Professional and business services, which include temporary help, engineering and software design, added 62,000 jobs. The retail sector rebounded, while health care and manufacturing continued to gain. Manufacturers added 16,000 jobs.

    Wages inched ahead. Average hourly earnings rose by one cent to $23.38. Wages were up 1.8% year over year. The average workweek was unchanged at 34.5 hours.

    A broader measure of unemployment—which includes job seekers as well as those stuck in part-time jobs—was unchanged at 14.5%.

    Write to Jeffrey Sparshott at [email protected] and Josh Mitchell at [email protected]

    ---

    Read more at The Wall Street Journal: http://online.wsj.com/article/SB10001424052702304743704577383713904032818.html?mod=WSJ_hp_LEFTTopStories#printMode

    Monday
    Apr302012

    Brooks, Vann and Walorski: Health Care Overhaul Is Wrong for Families 

    By Maggie Brooks, Kim Vann and Jackie Walorski
    Roll Call Editorial 
    April 30, 2012
    http://www.rollcall.com/issues/57_129/-214170-1.html

    As women who have had to balance our families’ checkbooks, we believe we have a unique perspective on how the policies being made in Washington, D.C., will eventually affect average pocketbooks across America. Unfortunately, Washington is broken and only making life harder for families who are already struggling to make ends meet.

    A prime example is the Democrats’ government takeover of health care, and the emerging picture should deeply concern any woman who wants to ensure they have quality health care for themselves and their family. House Minority Leader Nancy Pelosi (D-Calif.) recently called this big-government behemoth the “crown jewel” of the Democrats’ agenda, so it is certainly worth examining how it would affect our families.

    President Barack Obama promised, “If you like your health care plan, you can keep your health care plan,” but the facts now say otherwise. With the government takeover of health care beginning to take effect, it now seems millions of families will be forced to find health care elsewhere when the big-government law applies its mandates and fees. The nonpartisan Congressional Budget Office estimates that as many as 20 million people will be forced from their health insurance plans as the 2010 law takes full effect. This represents an enormous broken promise and a significant intrusion on millions of families and their ability to make their own health care decisions free from government interference.

    For the family pocketbook, the law is contributing to rising health care premiums that are hurting many in these difficult times. Last year, health insurance premiums on average climbed 12.3 percent, and that number isn’t likely to change soon. It should be no surprise that government mandates and $500 billion in new taxes will make health care more expensive, and this is having a devastating effect on family finances that are already stretched thin. Instead of focusing on creating jobs and fixing the economy, the Democrats’ “crown jewel” since they took control of Washington is actively making life harder for families and small businesses across the country.

    For the next generation, the government takeover of health care is proving to be a ticking deficit time bomb and hardly revenue-neutral as Democrats claimed when they passed it. The latest estimates show Obamacare could add up to half a trillion dollars to the deficit, and this is on top of the largest spending spree in history already happening in Washington. Democrats passed their government health care takeover, and both you and your children as future taxpayers will be forced to sacrifice down the line to pick up the tab.

    And yet the Democrats refuse to listen to the objections of American families. House Minority Whip Steny Hoyer (D-Md.) insists that the health care takeover is becoming more and more popular as more provisions of the law come into effect, but polls show the complete opposite is happening. A solid majority of American voters — 53 percent to 39 percent according to a recent ABC News/Washington Post poll — opposes their failed big-government experiment, and opinions of the law are at all-time lows with no end in sight.

    But instead of recognizing this fact, out-of-touch Democratic leaders in Washington remain blissfully ignorant to the outrage voters across the country feel. In fact, Democrats are vowing to make this a key issue in their re-election campaigns, even though the law has only grown more unpopular. 

    What we and millions of families across the country are left with is a string of broken promises that will continue to unravel and make life even harder for families already struggling with the stagnant economy.

    When something sounds too good to be true, it usually is, and the Democrats’ government takeover of health care is a reminder that this is all too common in Washington.

    The stark reality of the law — families forced off their current health insurance plans, rising monthly premiums and soaring costs for taxpayers — should be more than enough to demonstrate why Obamacare must be repealed and replaced with a patient-centered approach instead.

    Pelosi famously said, “We have to pass the bill so you can find out what is in it.” We now know what’s in it, and we’ve had enough.

    Maggie Brooks is a Republican House candidate in New York’s 25th district. Kim Vann is a Republican House candidate in California’s 3rd district. Jackie Walorski is a Republican House candidate in Indiana’s 2nd district.